Overview:
For my Capstone, I am completing a research project on evaluating running form and I have briefly described the project and preliminary results below. My goals from here are to continue analyzing the results and to submit the final product for publication in a professional journal. If anyone is interested in reading the full manuscript when it is completed, I would be happy to share it!
Introduction:
Over 9 million Americans are runners and an estimated 19-79% are injured annually.1,2 In a physical therapy setting, part of the evaluation and treatment for these runners often includes a gait analysis of their running form. One key skill for therapists to possess is the ability to determine specific mechanics and running style accurately using observational gait analysis.
In a clinical setting, visual running gait analysis can be performed through simple observation or through video recording and use of more technical tools. For example, standard video cameras, high-speed cameras, iPhones, iPads, and numerous applications can all be used to assist in evaluating running form with features such as slow motion, pause, drawing joint centers and angles, etc. The question is, however, do these technological tools improve our ability to visually determine running gait mechanics accurately and reliably?
One specific aspect of running mechanics that is important to determine is footstrike pattern, or where, in relation to the ankle joint, the runner’s foot initially makes contact with the ground when landing.3,4 Traditionally, the majority of shod runners, approximately 75%, land with a “heel strike” or “rearfoot strike” (RFS) pattern. In contrast, the other 25% of runners land with an “anterior” footstrike (AFS) pattern which includes a forefoot or mid-foot strike.5,6 A growing amount of research emerging in the running community involves running gait retraining to adjust mechanics in attempt to reduce injury risk.3,7,8,9 One aspect of running mechanics that can be targeted is altering footstrike pattern.3 One recent study attempted to determine the accuracy of a kinematic method and visual determination for footstrike pattern detection as compared to a gold standard of strike index, and minimal differences were found between the kinematic method and visual observation.10 One of the authors’ conclusions included that possibly using a standard camera and slow motion video to determine and categorize runners by foostrike pattern.10
The purpose of this research study is to assess the ability of physical therapists and physical therapy students to determine a runner’s footstrike pattern by viewing both real-time and slow motion speeds using video recordings of runners on a treadmill.
We will investigate the following research questions:
Accuracy:
- Does physical therapy experience significantly affect the ability to determine footstrike pattern?
- Does video playback speed significantly affect the ability to determine footstrike pattern?
- Do physical therapy experience and video playback speed significantly interact to affect the ability to determine footstrike pattern?
Time:
- Does physical therapy experience significantly affect the time required to determine footstrike pattern?
- Does video playback speed significantly affect the time required to determine footstrike pattern?
- Do physical therapy experience and video playback speed significantly interact to affect the time required to determine footstrike pattern?
Table 1. Summary of Variables: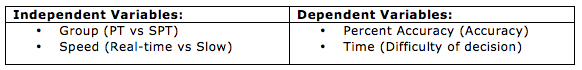
Methods:
Subjects:
- Twenty individuals were recruited via email to participate in this study. Group 1 (n=10) were physical therapists (PTs) who either had experience evaluating and treating runners for a minimum of 2 years or had a current caseload of a minimum of 20% runners. Group 2 (n=10) were 3rd year UNC physical therapy students (SPTs) who did not have any specialized training in evaluating running form such as running laboratory experience, running shoe store employment, etc. See Table 2.
Table 2. Descriptive Statistics for Subjects: Mean (SD)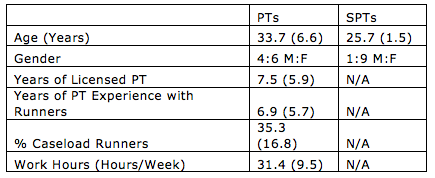
Instrumentation:
- The videos for this study were taken with a standard video recorder at a frame rate of 60Hz and each video has accompanying kinetic and kinematic data detailing the runner’s biomechanics. They exist from a previous study by Goss and Gross and the authors have granted permission for further use of them. Of the 87 existing videos, 24 were selected for inclusion in the current study. Some videos were eliminated for specific footwear including barefoot, sandals, and Vibram 5 finger shoes. The remaining videos were subdivided into 4 categories based on their footstrike pattern (Rearfoot strike or Anterior footstrike) and difficulty of determination (Easy or Difficult).
- The footstrike pattern has been assigned confidently through the gold standard of kinetic and kinematic data. Rearfoot strike (RFS) is defined as the runner’s foot makes initial contact with the ground posterior to the ankle joint center and Anterior footstrike (AFS) is defined as the runner’s foot makes initial contact with the ground anterior to the ankle joint center.
- The difficulty of determination has been assigned by visual opinion of an expert in running gait analysis, Dr. Gross, who has 33 years of experience evaluating running gait.
- From each of these 4 categories (Easy RFS, Difficult RFS, Easy AFS, and Difficult AFS), the first 6 videos that were not excluded for above reasons were chosen for inclusion in the current study. Each of these subdivisions was represented equally in the videos that each subject views. Of the total 24 videos, two versions of each video were used. One was at Real-time Speed and one was at Slow-motion Speed that has been slowed to 25%, or 4x slower than Real-time.
- The 20 subjects were randomly assigned to one of two counter-balanced Groups (Group A and Group B). Group A included 5 students and 5 PTs and they watched videos 1-12 in Real-Time and videos 13-24 in Slow motion. Group B included 5 students and 5 PTs and they watched videos 1-12 in Slow motion and videos 13-24 in Real-time. Each subject watched 12 videos of the same Speed first followed by 12 videos of the other Speed. Subjects were randomly assigned to view either the Fast or Slow videos first. Within the Speed groups, the presentation order of videos was randomized for each subject, through use of an online random numbers generator.11 See Table 3.
Table 3. Description of Video by Group with Footstrike and Difficulty classifications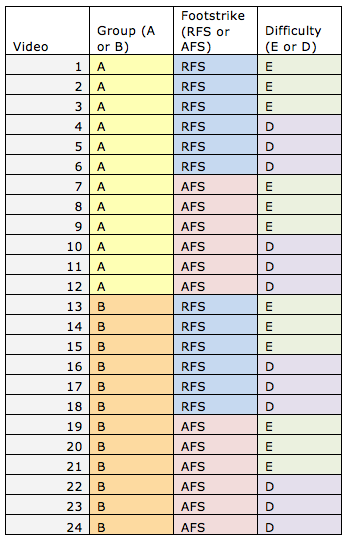

Testing Methods:
- Testing sessions were conducted at a location of the subjects’ convenience and lasted 30 minutes or less per subject. Subjects provided informed consent and completed a brief questionnaire related to PT experience. (See Table 2.) Standardized instructions for completing the session and a written definition of the two footstrike patterns were issued to the subjects prior to beginning the session. Each subject viewed the 24 videos played on loop on the researcher’s computer and verbally stated a determination of footstrike pattern. The researcher recorded the response and the amount of time from when the subject pressed play on the computer to when they verbally stated their answer. This period of time was measured to the nearest tenth of a second using the Stopwatch feature on an iPhone.
Data Analysis:
- The data were compiled in Excel and basic statistics have been performed on descriptive information and preliminary results. The data will be analyzed further using ANOVA procedures.
Preliminary Results:
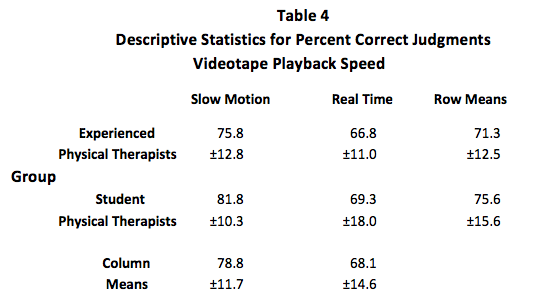

Results by Accuracy of Judgment (Table 4 and Table 5):
1. No interaction effect was present between group and videotape playback speed.
2. Judgments were significantly more accurate at the slow motion playback speed compared to the real time playback speed.
3. The 2 groups did not differ significantly with regard to accuracy of judgments.
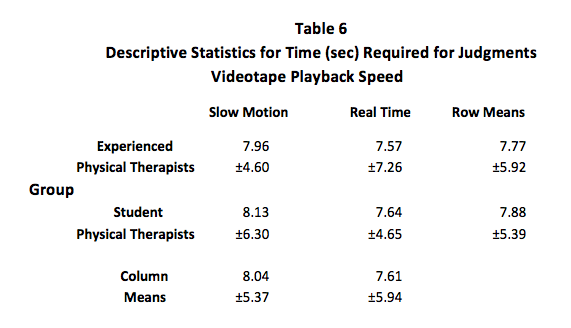

Results by Time of Judgment (Table 6 and Table 7):
1. No interaction effect was present between group and videotape playback speed.
2. Time required to make judgments was not significantly different between the playback speeds.
3. The 2 groups did not differ significantly with regard to time required to make judgments.
Discussion:
Overall, the accuracy of assessments was significantly greater when the videos were played at ¼ speed as compared to real-time speed. Clinically, this supports an argument for video taping a runner and replaying the video at ¼ speed when attempting to determine running footstrike pattern. Experience of therapist did not significantly differ in terms of accuracy. One interpretation for this is that viewing where the foot lands on the treadmill is a relatively unskilled task that is not affected by experience; whereas, a task such as viewing all the lower extremity joint mechanics and combining them to make a complete clinical assessment of a runner could be a more skilled task. Additionally, time required to make judgments was not significantly influenced by videotape playback speed or experience. However, it is important to consider that in the same amount of time, the viewer is seeing approximately four times as many foot-falls to make the judgment at the real-time speed than at the slow motion speed. This increase in number of foot-falls viewed at the more challenging real time playback speed could account for the lack of difference in the time required for judgment. Or alternatively, the lack of difference in time could simply reflect improved ability to analyze the footstrike at slow motion speed regardless of time. Clinically, this increases the strength of the argument for video taping and slowing the videos down, because it not only improves accuracy but it also does not take more time to make a judgment than in real-time speed. Above the group results are explored, however it is interesting to note that a minority of videos presented in a different way. Further analysis and exploration is planned on these individuals to capture a complete clinical picture, including those in the minority of runners.
Limitations:
A number of limitations existed in this study. The videos used existed from a previous study and were not specifically recorded for the purpose of viewers watching them and rating them at a later time. A greater frame rate, more exact lateral positioning, and increased lighting may have led to increases in accuracy rates across the board. Additionally, footstrike is only one mechanic, and realistically, evaluating running form involves analyzing the complete runner through many joints and mechanics.
Acknowledgements:
I would first and foremost like to thank Mike Gross and Charlie Sheets for encouraging my pursuit of a Capstone in an area that really interests me, as well as helping me develop and carry out this research project. You are both brilliant and have dedicated way too much time and effort to this project, I can’t thank you enough. I would also like to acknowledge Don Goss, Richard Faldowski, and Justin Wilhelm, for their helpful guidance along the way. Also, a huge thanks to all the participants, specifically Duke University PT, Duke Sports Med PT, Proaxis Therapy of Carrboro and Chapel Hill, & many UNC DPT classmates.
References:
1. 2013 State of the Sport – Part II: Running Industry Report. Running USA. Available at http://www.runningusa.org/state-of-sport-2013-part-II?returnTo=annual-reports.
2. van Gent RN, Siem D, van Middelkoop M, van Os AG, Bierma-Zeinstra SM, Koes BW. Incidence and determinants of lower extremity running injuries in long distance runners: a systematic review. Br J Sports Med. 2007;41(8):469-480.
3. Lieberman DE, Venkadesan M, Werbel WA, et al. Foot strike patterns and collision forces in habitually barefoot versus shod runners. Nature. 2010;463(7280):531-535.
4. Goss DL, Gross MT. A Comparison of Negative Joint Work and Vertical Ground Reaction Force Loading Rates in Chi Runners and Rearfoot-Striking Runners. JOSPT. 2013;43(10): 685-692.
5. Hasegawa H, Yamauchi T, Kraemer WJ. Foot strike patterns of runners at the 15-km point during an elite-level half marathon. J Strength Cond Res. 2007;21(3):888-893.
6. Gross DL, Gross MT. A Review of Mechanics and Injury Trends Among Various Running Styles. US Army Medical Department Journal. 2012;Jul-Sept:62-71.
7. Willy RW, Scholz JP and Davis IS. Mirror gait retraining for the treatment of patellofemoral pain in female runners. Clinical biomechanics. 2012; 27:1045-1051.
8. Noehren B, Scholz JP, Davis IS. The effect of real-time gait retraining on hip kinematics, pain and function in subjects with patellofemoral pain syndrome. Br J Sports Med. 2011; 45(9): 691-696.
9. Crowell HP, Davis IS. Gait retraining to reduce lower extremity loading in runners. Clin Biomech. 2011;26(1):78-83.
10. Altman AR, Davis IS. A kinematic method for footstrike pattern detection in barefoot and shod runners. Gait & Posture. 2012;35:298–300.
11. Random Number Generator. Stat Trek website. Available at http://stattrek.com/statistics/random-number-generator.aspx. Accessed on March 21, 2014.
4 Responses to “Visual Detection of Running Footstrike Pattern”
Stephanie Lawson
Abby,
Fantastic work. I think your study is very fascinating. First, great job on the explanation. It was very thorough and very easy to read and understand. I knew you were dealing with running mechanics, but had no idea how involved you were and the influence of technology. How interesting that students faired a little better than the PT’s. Any insight into this? I know my little knowledge was enhanced by Dr. Goss’ lecture on forefoot running, but that’s all my experience! Like Gabrielle said, did you ask if the participants were runners? Does that influence the results at all? I know your focus is in the technology, but just wondering! I can’t wait to see what comes of this! Awesome job!
Gabrielle Scronce
Abby, I agree with Michelle that your charts, descriptions, and organizations are fantastic! I love everything about this post from the research topic to the layout. I will admit that I wasn’t expecting to see results of SPTs showing greater accuracy than PTs with footstrike identification. The large standard deviation for SPT accuracy in Real-Time helps explain my surprise since I think I might have actually been the -17.99. It also made me realize that I honestly can’t remember if you asked background questions about history of running or orthopedic rotation experiences for students. Based off the data that you do have, can you suggest any reasons that might improve SPT/PT accuracy in identifying footstrike pattern? Do people who run themselves have a better eye? I know I’m always (weirdly) watching people’s gait patterns when I run in groups, but what if all that practice actually reinforces my own incorrect perception of footstrike patterns? Thanks for your insight!
Abby Osborn
Hey Michelle,
Thanks for your feedback! The overarching bigger picture for me is answering the question, how well do we see what we think we see? In addition to this, I think that balancing *technology* with time required to use *technology* is another interesting predicament, and one that will appear frequently in clinical practice in the future. I have definitely considered further research one day, but no clue as to what direction I would take it in just yet. 🙂
Thanks again!
Abby
Michelle Green
What an ambitious task yo have taken on and more impressively, it seems as if you an interest in research. I find the topic interesting and am wondering what the “bigger” picture for your results might include. In other words, how can this information change our practice as therapists and have you considered further research, if so, what would be the focus? Great job on the charts, they offer a quick, easy to understand overview of your information.